
In digital landscape, where content is king, standing out from the crowd requires creativity, strategy, and an understanding of what truly drives engagement. At Kito Agency, we believe that Infographics SEO Strategy are one of the most powerful tools in an SEO strategist’s toolkit. This comprehensive guide will walk you through the ins and outs of infographic SEO, showing you how to leverage these visually compelling assets to boost your online presence and dominate search engine rankings in 2024.
Why Infographics SEO Strategy Matter in SEO
Before diving into the strategies, it’s essential to understand why infographics are so effective for SEO.
1. Visual Content and User Engagement
The human brain processes visual content 60,000 times faster than text. This means that infographics, which combine images, charts, and concise text, can deliver complex information quickly and in a more digestible format. Users are more likely to stay on a page with a well-crafted infographic, reducing bounce rates and signaling to search engines that the content is valuable and relevant.
2. Shareability and Virality
Infographics are inherently shareable. On platforms like Pinterest, Instagram, Twitter, and LinkedIn, infographics often outperform traditional blog posts or articles in terms of shares and likes. The more your infographic is shared, the more it circulates across the web, increasing the likelihood of generating backlinks—a crucial factor in boosting domain authority and search engine rankings.
3. Backlink Generation
One of the most significant SEO benefits of infographics is their ability to attract backlinks. A single, high-quality infographic can earn hundreds of backlinks from various websites. These backlinks not only drive referral traffic but also contribute to your site’s overall authority, which is a critical ranking factor in Google’s algorithm.
4. Keyword Optimization
Infographics provide ample opportunities to optimize for keywords. This includes the title of the infographic, the accompanying blog post, image alt text, and even the file name. Proper keyword integration ensures that your infographic ranks in image search results and contributes to your overall content strategy.
5. Infographics SEO Strategy for Visual Search
With the rise of visual search tools like Google Lens, optimizing images and infographics is becoming increasingly important. Infographics that are well-optimized for SEO can be easily discovered through visual search, providing yet another channel for potential traffic.
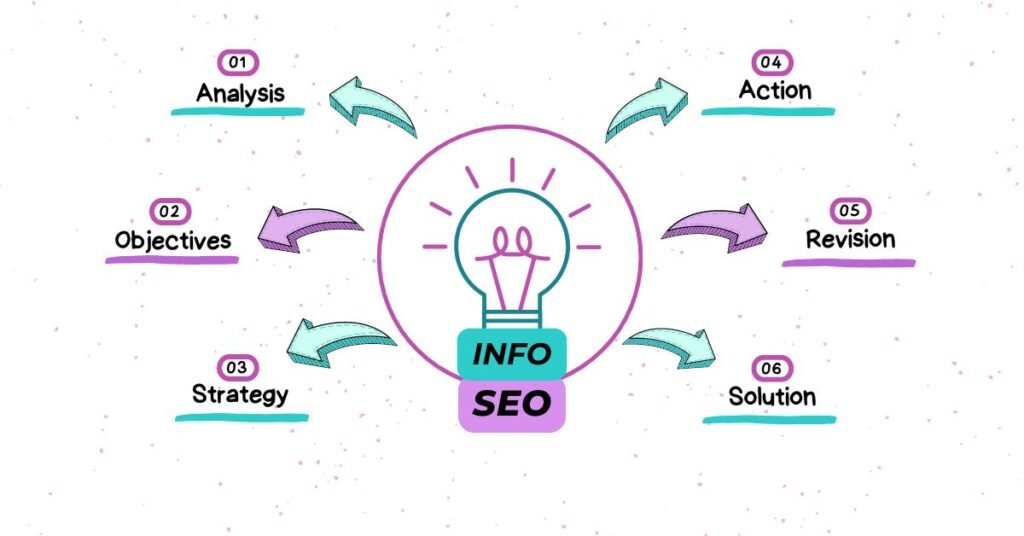
Developing an Effective Infographics SEO Strategy
Now that we understand the importance of infographics in SEO, let’s delve into the steps to create a strategy that maximizes these benefits.
1. Research and Ideation: Building a Foundation
Every successful infographic starts with a strong foundation. Here’s how to lay the groundwork:
a. Identify Your Audience
Understanding your target audience is the first step. What are their pain points? What kind of content do they engage with? Tools like Google Analytics, social media insights, and customer feedback can help you identify the topics that will resonate most with your audience.
b. Conduct Thorough Keyword Research
Keyword research is crucial to the success of any SEO strategy, including infographics. Use tools like Ahrefs, SEMrush, or Google Keyword Planner to identify high-volume, low-competition keywords related to your topic. Look for long-tail keywords and questions that your audience is asking. These can often be turned into engaging infographics that answer specific queries, positioning your content as a valuable resource.
c. Analyze Competitors
Examine what your competitors are doing with infographics. Which of their infographics have been most successful? What keywords are they targeting? Tools like BuzzSumo can help you see which infographics are getting the most shares and backlinks. By understanding what works in your industry, you can create infographics that not only match but surpass your competitors.
d. Brainstorming and Conceptualization
Once you’ve gathered your research, it’s time to brainstorm infographic ideas. At Kito Agency, we recommend focusing on topics where visual representation adds significant value. For example, data-heavy topics, step-by-step processes, or comparative analyses are perfect for infographics. Ensure that each idea aligns with your brand message and serves a clear purpose in your overall content strategy.
2. Designing for Impact: How to Make Your Infographics Stand Out
Design plays a critical role in the success of your infographic. Here’s how to ensure your design is not only aesthetically pleasing but also optimized for SEO:
a. Prioritize Clarity and Simplicity
Your infographic should convey information clearly and concisely. Avoid clutter and focus on the main message. Use whitespace effectively to make your infographic easy on the eyes, and choose a color palette that aligns with your brand while enhancing readability.
b. Use High-Quality Visuals
Invest in high-quality images, icons, and illustrations. Poor-quality visuals can detract from the credibility of your content. Tools like Adobe Illustrator, Canva, or Piktochart offer extensive resources for creating professional-grade infographics.
c. Optimize for Different Devices
Ensure your infographic is mobile-friendly. With the increasing number of users accessing content on their smartphones, a responsive design that looks great on all devices is essential. Break down larger infographics into smaller sections or create multiple versions for different platforms to enhance accessibility.
d. Incorporate SEO Best Practices
Don’t overlook the technical aspects of SEO in your design process:
- Title: Include your primary keyword in the infographic title.
- Alt Text: Write descriptive alt text that includes relevant keywords.
- File Name: Save the infographic file with a keyword-rich name.
- Meta Description: When embedding the infographic on your website, craft a compelling meta description that includes target keywords.
3. Content and On-Page Optimization: Maximizing Visibility
Once your infographic is designed, the next step is to ensure it’s optimized for search engines:
a. Create Supporting Content
An infographic should not stand alone. Pair it with a well-written, keyword-optimized blog post or article. This accompanying content helps search engines understand the context of the infographic and provides additional opportunities to rank for related keywords.
b. Use Header Tags Effectively
Organize your supporting content with header tags (H1, H2, H3) that include your target keywords. This structure not only improves readability but also helps search engines crawl and index your content more efficiently.
c. Embed the Infographic Strategically
Embed the infographic within your content in a way that encourages engagement. For example, place it near the top of the page to grab attention, but provide enough introductory text to ensure the page ranks well. Include a call-to-action (CTA) that encourages users to share the infographic or explore related content.
d. Optimize URL Structure
The URL of the page where your infographic is hosted should be short, descriptive, and include your primary keyword. A clean URL structure improves SEO and makes it easier for users to share your content.
4. Promotion and Outreach: Amplifying Your Reach
Creating a great infographic is just the first step. Promotion is key to maximizing its SEO potential.
a. Leverage Social Media
Promote your infographic across all relevant social media platforms. Customize your approach for each platform. For instance, use Pinterest to tap into its visual-centric audience, or post on LinkedIn if your infographic caters to a professional audience. Don’t forget to use relevant hashtags to increase discoverability.
b. Email Marketing
Include your infographic in your email marketing campaigns. Whether it’s part of a newsletter or a dedicated email, infographics can increase engagement rates and encourage subscribers to share your content with their networks.
c. Outreach for Backlinks
Proactively reach out to industry influencers, bloggers, and websites that may be interested in your infographic. Offer them the opportunity to embed the infographic on their sites with a link back to yours. Tools like BuzzStream and Pitchbox can help streamline your outreach efforts. Personalize each pitch to increase your chances of success.
d. Submit to Infographic Directories
There are numerous infographic directories where you can submit your content for additional exposure. Sites like Visual.ly, Infographic Journal, and Cool Infographics can help drive traffic and generate backlinks.
e. Paid Promotion with Infographics SEO Strategy
Consider using paid promotion to give your infographic an initial boost. Platforms like Facebook Ads or Google Display Network allow you to target specific demographics, ensuring your infographic reaches the right audience.
5. Tracking and Analysis: Measuring Success
No SEO strategy is complete without tracking and analyzing performance. Here’s how to measure the success of your infographic:
a. Monitor Key Metrics
Use tools like Google Analytics, Ahrefs, or SEMrush to monitor the performance of your infographic. Key metrics to track include:
- Organic Traffic: Measure the increase in traffic to the page hosting your infographic.
- Backlinks: Track the number and quality of backlinks generated.
- Social Shares: Analyze how often your infographic is being shared on social media.
- Engagement Metrics: Monitor metrics like bounce rate, time on page, and scroll depth to gauge user engagement.
b. Evaluate Keyword Rankings
Check how well your infographic and the accompanying content are ranking for your target keywords. If rankings are not improving, consider revisiting your keyword strategy or making adjustments to the content.
c. Analyze Competitor Performance
Keep an eye on your competitors’ infographics. If they are outperforming you in terms of shares, backlinks, or rankings, analyze what they are doing differently and adapt your strategy accordingly.
d. Adjust and Optimize
SEO is an ongoing process. Use the data you collect to make informed decisions about how to optimize future infographics. This could involve refining your keyword strategy, adjusting your outreach approach, or experimenting with different design elements.
6. The Future of Infographic SEO: Preparing for 2024 and Beyond
As we move into 2024, it’s essential to stay ahead of the curve. Here are a few trends and technologies that could impact your infographic SEO strategy:
a. Voice Search Optimization
With the rise of voice search, optimizing your infographics for conversational queries will become increasingly important. Consider incorporating long-tail keywords and question-based phrases into your supporting content to capture voice search traffic.
b. Interactive Infographics
Interactive infographics, which allow users to engage with the content through clicks, scrolls, and animations, are likely to gain traction. These infographics not only enhance user experience but also increase time spent on the page—a key SEO metric.
c. Visual Search Technology
As visual search continues to grow, optimizing infographics for visual search engines like Google Lens will become crucial. Ensure your infographics are easily scannable by visual search tools by using clear, high-quality images and proper alt text.
d. Sustainability and Ethical Considerations
Consumers are increasingly concerned about sustainability and ethics. Infographics that address these topics or that are designed with these principles in mind (e.g., using eco-friendly design practices or promoting social causes) may see increased engagement and shareability.
Conclusion

Infographics are a powerful tool in the SEO landscape, offering a unique blend of visual appeal and informational depth that can drive traffic, increase engagement, and boost search engine rankings. However, their success depends on a well-crafted strategy that includes research, design, content optimization, promotion, and ongoing analysis.
At Kito Agency, we specialize in creating and executing infographic SEO strategies that deliver results. Whether you’re looking to boost your brand’s visibility, attract more backlinks, or improve user engagement, our team has the expertise to help you achieve your goals.
Ready to transform your SEO strategy with infographics? Contact us today to learn how Kito Agency can help you create visually stunning, SEO-optimized infographics that drive measurable results.
For more tips and strategies on SEO and digital marketing, be sure to subscribe to the Kito Agency blog. We’re here to help you stay ahead in the ever-changing world of digital marketing!
very informative articles or reviews at this time.
You really make it seem really easy together with your presentation but I to
find this matter to be really something which I believe I
would by no means understand. It sort of feels too
complicated and extremely huge for me. I am
taking a look forward in your next submit, I’ll attempt to get the grasp of it!
Hello there, I found your blog by means of Google even as searching
for a related topic, your site came up, it appears to be
like good. I have bookmarked it in my google bookmarks.
Hi there, just became alert to your weblog through Google, and found that it’s really informative.
I’m going to watch out for brussels. I’ll appreciate in case you proceed this in future.
A lot of other folks shall be benefited out of your writing.
Cheers!
¡Buen día!
Estuve mucho tiempo no podía entender sobre cómo mejorar los parámetros de Ahrefs, Domain Rank, el sitio y mis proyectos y descubrí >>>
Xrumer ayuda a aumentar el DR y mejorar los índices de Ahrefs mediante linkbuilding automático. El paso de enlaces a través de foros permite crear rápidamente enlaces externos. La creación masiva de enlaces con Xrumer da resultados rápidos. Los programas para linkbuilding simplifican el proceso de obtención de enlaces. Prueba Xrumer para un SEO exitoso.
Encontré a unos chicos geniales, desarrollaron un envío barato y, lo más importante, productivo con Xrumer and Xevil 6 – https://ya.ru/search/?text=%D1%82%D0%B0%D1%80%D0%B8%D1%84+bullet&lr=2
AutomatizaciГіn de la creaciГіn de enlaces
Xrumer: creaciГіn de masa de enlaces
PublicaciГіn en foros para principiantes
Xrumer para crear una estrategia de enlaces
https://hostfrost.site
¡Mucho éxito y crecimiento en los rankings!
096FF12F662B80BFAC5039F02B44FAAD
I have read so many content concerning the blogger lovers however this piece of writing is genuinely
a pleasant post, keep it up.
My partner and I absolutely love your blog and find many
of your post’s to be exactly what I’m looking for.
can you offer guest writers to write content for you
personally? I wouldn’t mind composing a post or
elaborating on some of the subjects you write concerning here.
Again, awesome weblog!
Казино Риобет: твой шанс на крупный выигрыш riobet казино сайт